Could a free satellite have called Amsterdam's quay-replacement schedule?
Amsterdam is replacing 200 km of historic quay walls, guided by divers and engineers. The Netherlands publishes a free millimetre-precision InSAR subsidence map. I put the free signal on trial: pre-registered prediction, four failure directions tested, and a mechanism-tested null (AUC 0.49) that turned out to be the interesting answer.
If you walk along the Prinsengracht in spring you would swear the city has stood there forever. Brick and stone, three storeys above the water, a row of houseboats, the polished wood of the bridges. Things that look that solid have a way of feeling permanent.
None of it is solid, though. The walls along the canals (the kademuren) are masonry plates held against soft Holocene clay by long timber piles driven into the sand below. The piles are wooden, and the trick that has kept Amsterdam upright for four centuries is a quietly precarious one: as long as the piles stay submerged, anaerobic conditions stop them rotting. Lower the groundwater by a metre, expose the pile tops to oxygen, and the whole arrangement is on a clock.
Why the question was worth asking
This is not hypothetical. In September 2020 a stretch of the Grimburgwal, in the middle of the old centre, gave way into the canal. Nobody was hurt (the cars went into the water, the buildings behind held), but it was not the first near-miss, and the city took the hint. Amsterdam has roughly 200 km of quay walls and some 850 bridges, and it has committed to inspecting, repairing or replacing all of them under the Programma Bruggen en Kademuren, a multi-billion-euro programme running out to 2040.
How the city decides which quay goes next
The decision is made the way these things usually are: by people. Engineers commission inspections; divers go down to see what is left of the piles; drone photogrammetry surveys the masonry above the water. Judgement then weighs all of it against budget, contractor availability, and which canals sit next to which annual events. The output is a rolling priority list.
This works. It is also expensive: a single quay inspection runs into the tens of thousands of euros, and there are several thousand segments to get through.
Meanwhile, free of charge, somewhere over the North Sea
Since late 2014 a satellite called Sentinel-1 has overflown the Netherlands every six to twelve days (six while both Sentinel-1A and -1B flew, roughly 2016–2021; twelve otherwise), painting the country in radar. The radar bounces off any stable point (a roof corner, a kerbstone, the edge of a paving slab) and by stacking the returns over a decade and doing a fairly elaborate piece of phase arithmetic, you recover at each of those points a millimetre-precision time series of how the ground moved.
The Dutch government, through the Bodemdalingskaart, has done all of this for us already: a free, per-object ground-motion product covering the whole country, joinable to the building register, updated annually. Forty-odd billion measurements; millions of Persistent Scatterers; nothing left to process before you can start asking it questions.
So the question that would not leave me alone:
Did this signal already know what the divers and engineers concluded?
If it did, the city has been spending engineering hours to rediscover something that was sitting in a free CSV the whole time. If it did not (if the satellite misses the things the engineers catch), then the more interesting question is what it misses, and whether that gap could be characterised cheaply enough to triage where to send the divers. Either answer is worth writing down.
How I put the free signal on trial
What InSAR actually measures
Before the prediction, a few paragraphs of radar, because the whole result hangs on what this measurement can and cannot physically see, and almost every way of being wrong about quay walls starts with being wrong about that.
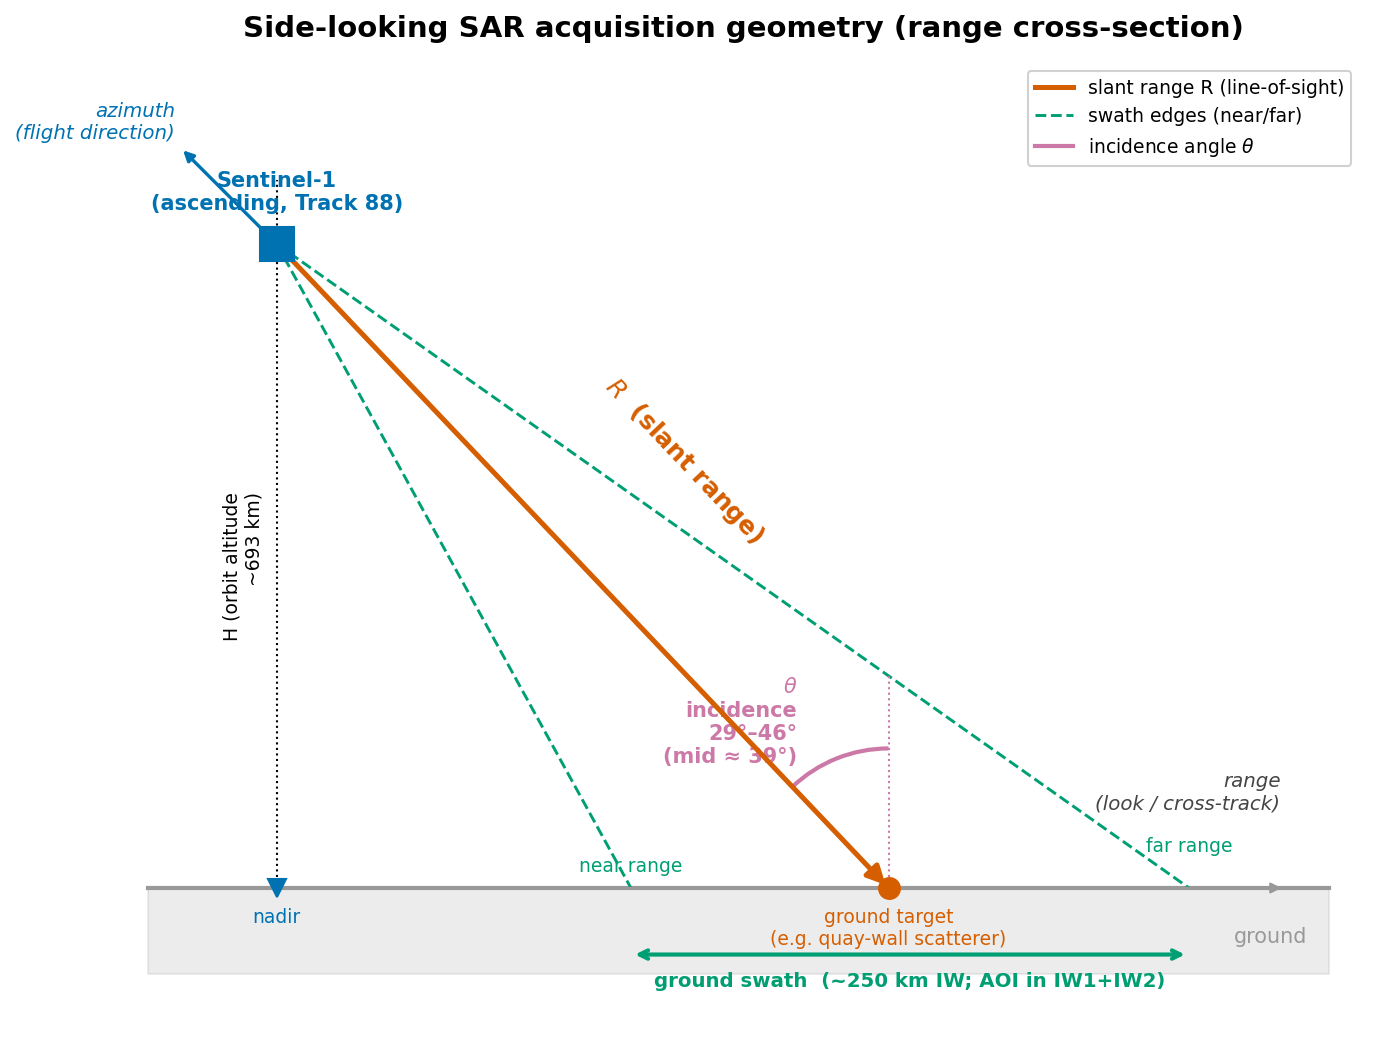
The geometry. Sentinel-1 is a side-looking radar, not a camera. It sits about 693 km up and looks off to the side at an incidence angle of roughly 39° over Amsterdam (29° at near range, 46° at far range), and what it records is the distance along that slanted line of sight: one number, in one direction. That geometry has a consequence I kept having to remind myself of: the measurement is one-dimensional. Vertical motion projects strongly onto the line of sight; east–west motion projects weakly; north–south motion (parallel to the satellite's flight track) is very nearly invisible. A quay wall that bulges sideways toward the water is moving in close to the worst direction this instrument has.
Phase, not pictures. The millimetres do not come from how bright the radar return is; they come
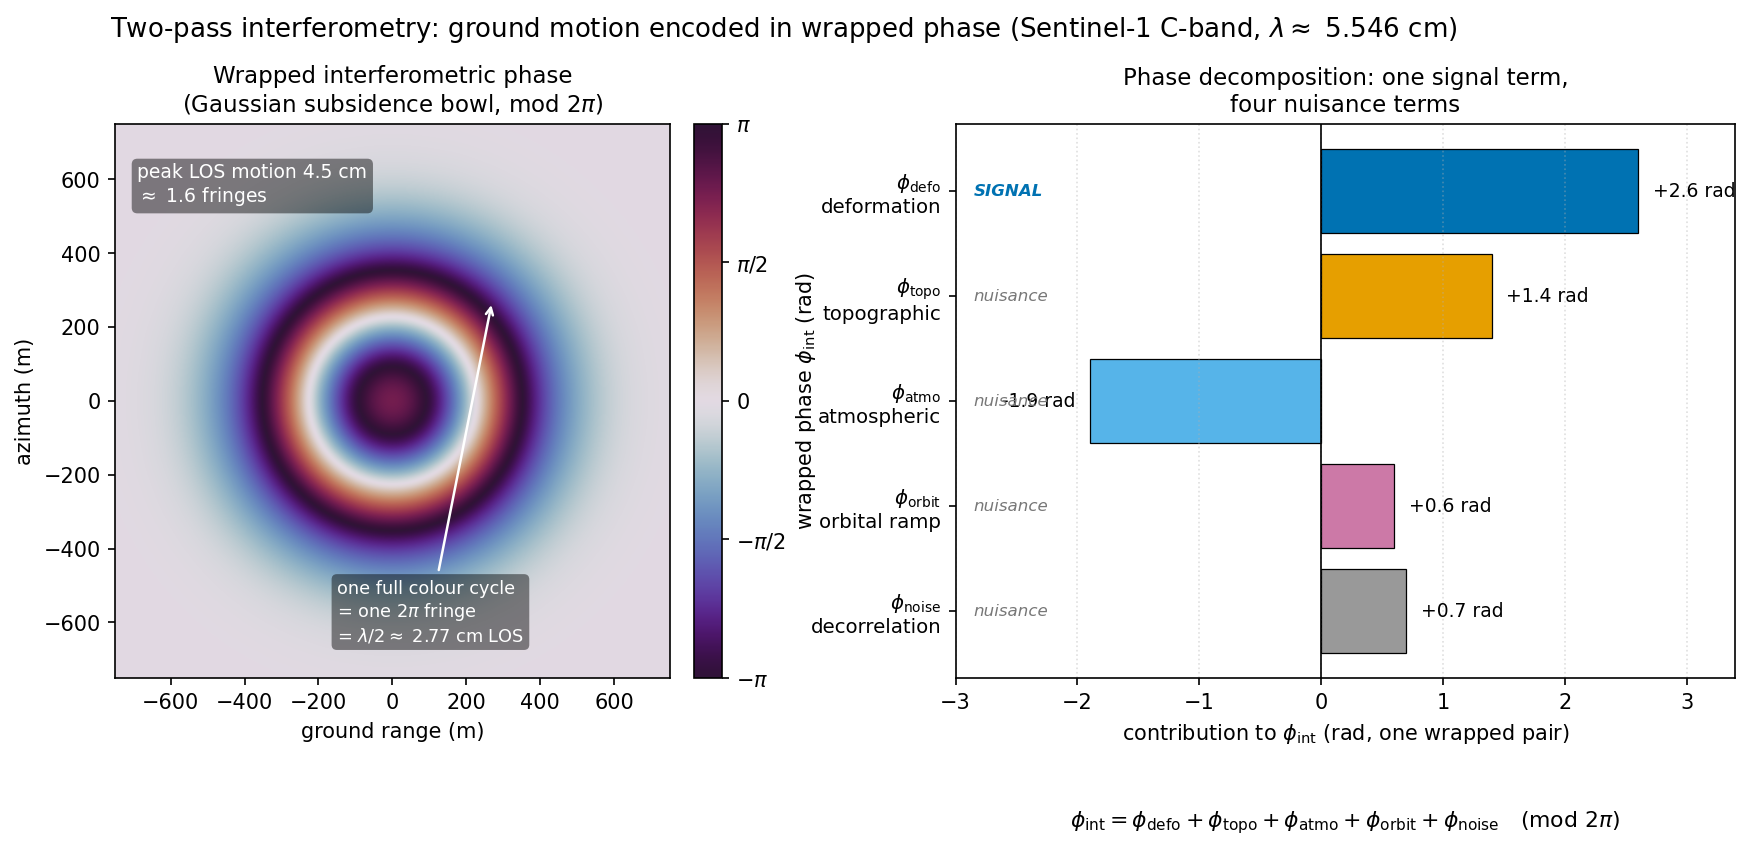
from its phase. C-band Sentinel-1 transmits at a wavelength of λ ≈ 5.5 cm. Subtract the phase of
one pass from another (that difference image is an interferogram) and the part of it caused by the
ground moving is φ_defo = −(4π/λ) · d_LOS, where d_LOS is the displacement along the line of
sight. One full 2π turn of phase corresponds to half a wavelength of motion, λ/2 ≈ 2.8 cm; a
single millimetre of subsidence is about a twenty-eighth of a fringe. That is where the precision comes
from, and, equally, where the fragility comes from, because phase only behaves this cleanly where the
same scatterer reflects the same way, pass after pass.
It is never just the signal. The catch is that φ_defo is not the only thing in the
interferogram. What you actually measure is φ_int = φ_defo + φ_topo + φ_atmo + φ_orbit + φ_noise:
deformation, plus a topographic term (the elevation model you subtracted is imperfect), plus
atmospheric delay (water vapour over the Randstad changes the path length and impersonates motion),
plus orbital error, plus noise. Every one of those nuisance terms has to be estimated and stripped out
before the residue can honestly be called ground motion. This is the part the national product has
already done, and done carefully (by a national agency that does nothing else), and it is the part
where, had it gone wrong, it would have gone wrong quietly.
Persistent Scatterers, and the noise floor. The trick that makes the whole thing tractable is to stop trying to measure every pixel and keep only the points that stay coherent across the entire decade-long stack: bright, stable reflectors like roof edges, kerbstones, and railings. These are the Persistent Scatterers, and the national product carries millions of them across the Amsterdam region. Note, however, where they sit: on the hard, dry, built fabric of the city, almost never on the waterline face of a quay wall, which is the surface that is actually doing the failing. Stacking hundreds of passes drives the velocity precision of a good Persistent Scatterer right down: the national product reaches about 0.05 mm/yr. So precision is not the floor that matters here. Keep that number in your pocket: when the radar fails to call the schedule later, it will not be because the ~0.8 mm/yr motions are too small to measure; it will be because the walls the city worked on and the ones it has not barely differ.
The finished product on trial, not my reprocessing
One honesty note before the result. I did not only consume a free CSV; I also rebuilt the entire chain from raw Sentinel-1 radar myself, 158 acquisitions and 726 GB of imagery, and held my home-made version up against the national product. Point by point it is noisy; it agrees with the national product only at neighbourhood scale. That calibration is a story in its own right, and it is the second post. But the question in this post is the city's question, so I put the finished national product on trial directly, exactly as the city could have. It is the mature, validated tool for this job; nothing in the result below rests on my own reprocessing.
The pre-registered prediction
Before any data hit the disk, I wrote down a prediction so I could be embarrassed by it later:
InSAR alone will explain roughly 65–75% of the city's priority list, in cross-validated AUC terms.
What came out
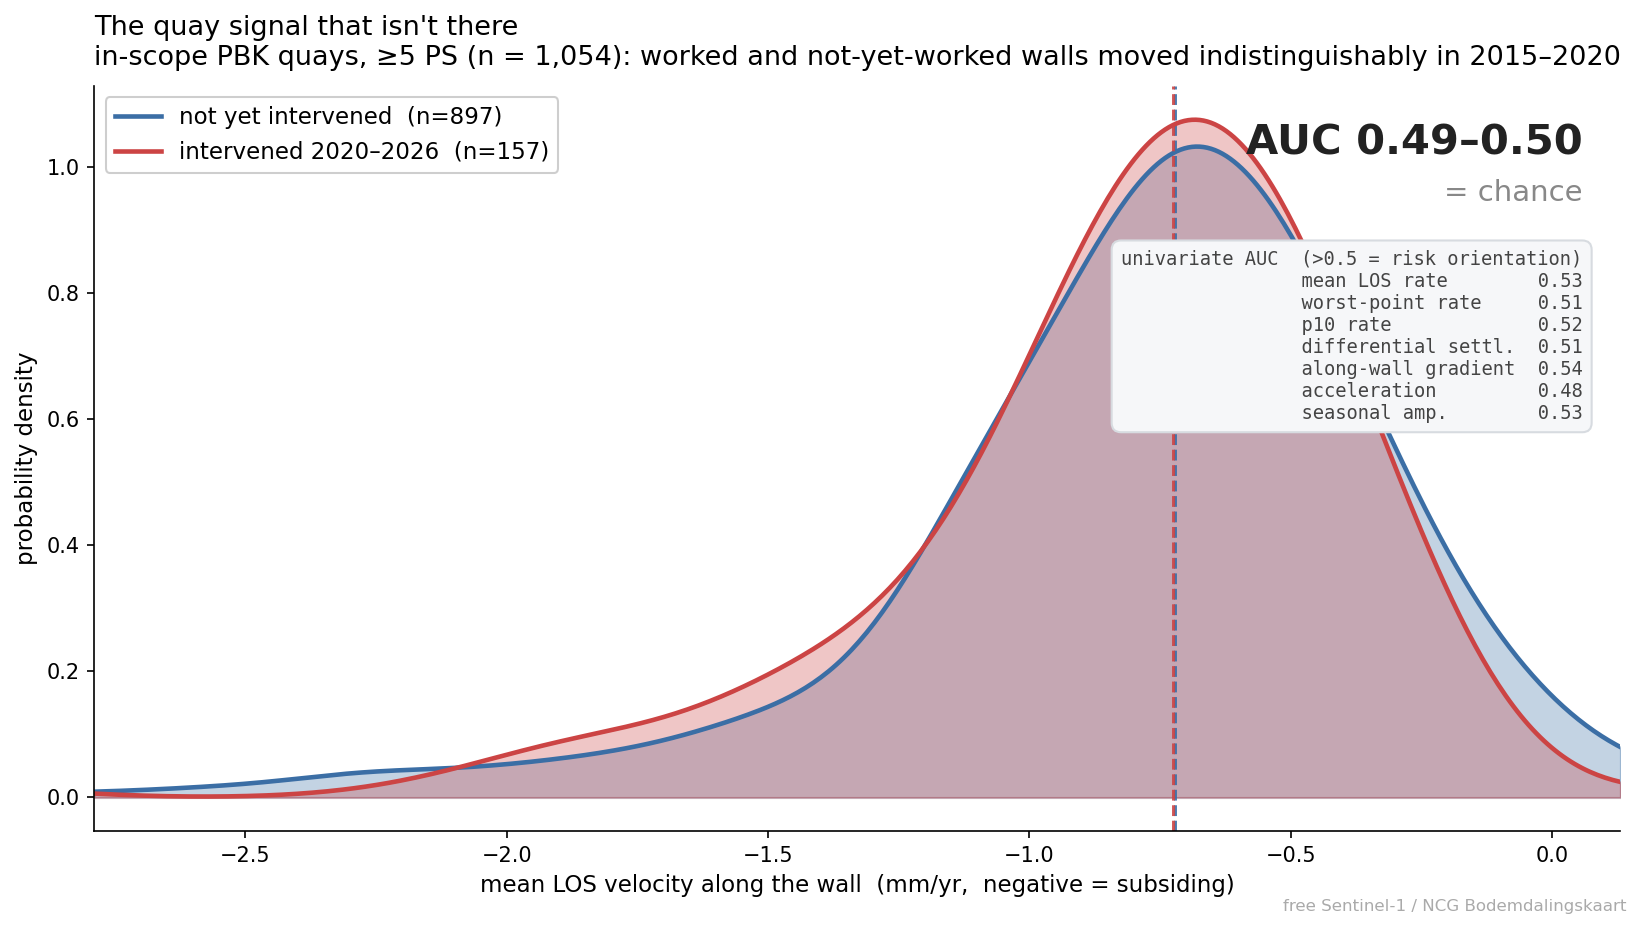
Here is the number that replaced the prediction. On the in-scope quays, with proper spatial cross-validation and the decision rule fixed before I looked, free InSAR alone predicts which segments the city has intervened on at an AUC of 0.49–0.50, no better than chance at this sample size. Against the city's own asset register (material, management district, segment length), the InSAR adds nothing: the incremental AUC is roughly zero (+0.002 with a logistic model, −0.014 with boosted trees), slightly negative on some folds.
So the prediction was not merely a little optimistic; it was wrong in the way that matters: the cheap signal did not already know what the divers and engineers concluded. The rest of this post is the why, because the why is more useful than the number, and because there is a company selling exactly this thing commercially, which makes "it does not work" a claim I owe you some care on.
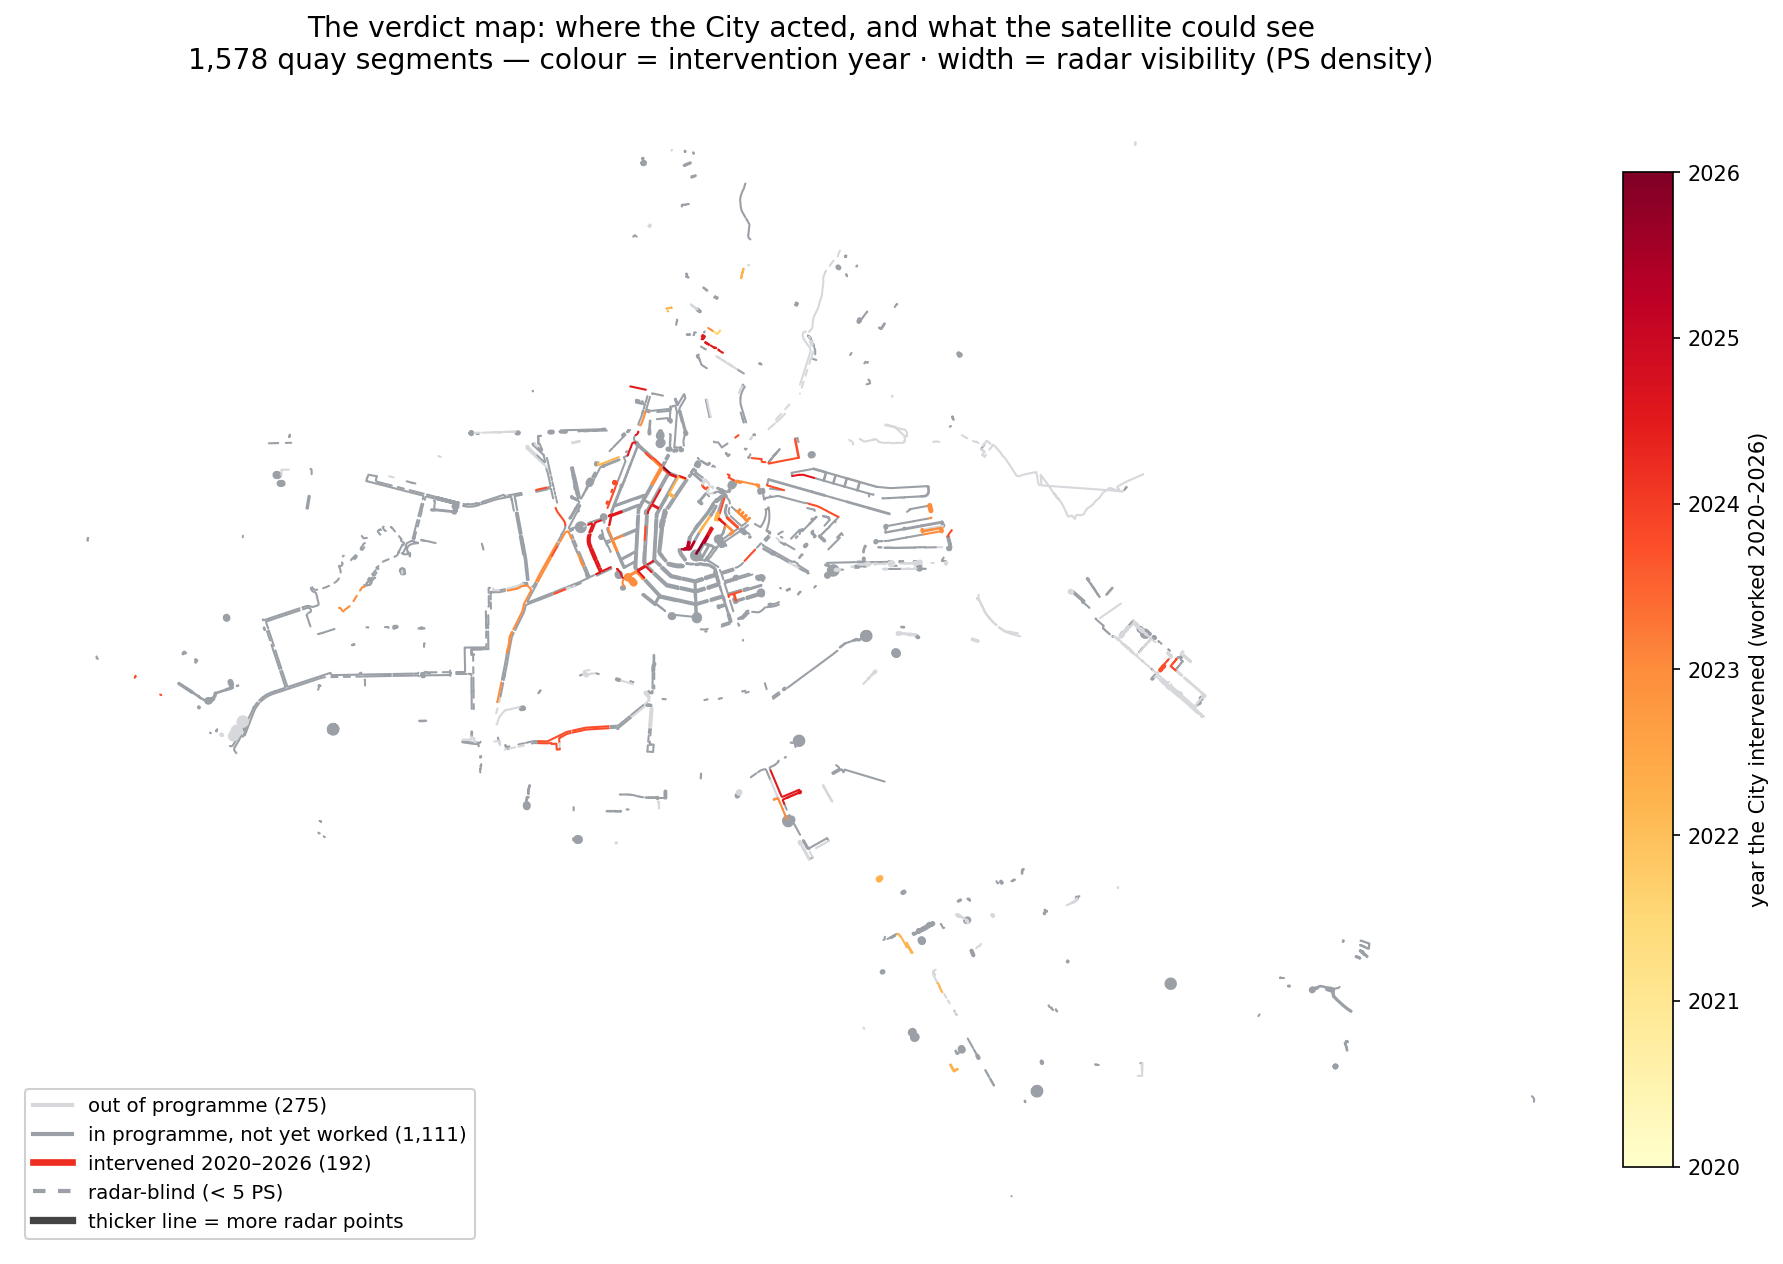
Before the why, though, look at the where. Here is the whole question on one map: every quay segment the city tracks, coloured by the year it actually intervened, with line thickness standing in for how well the free radar can even see each wall.
I gave it every direction to hide in
A null is only worth reading if the person reporting it tried to break it. Quay failure is mostly horizontal (the wall rotates toward the canal as the piles rot and the soil behind washes out), so a vertical satellite measurement testing the vertical component is testing the direction the failure is not in. That objection is correct, and I took it seriously. So I did not test one signal; I tested four, and I pre-registered each of them so I could not quietly move the goalposts afterwards:
- Vertical line-of-sight rate. Null.
- East–west horizontal, reconstructed by combining the national product's ascending and descending tracks (t088 + t110; my own single-track stack physically cannot resolve this). This one flickered (a p-value of 0.03), and for an afternoon I thought I had something. Then I projected the motion onto each wall's actual across-the-canal direction, which is what the physics predicts, and the signal dissolved. The flicker reads as a regional east–west gradient that happens to run through the centre where the intervened quays cluster, not as walls tilting toward their water. Pre-registration is the only reason I did not publish that flicker as a finding.
- Cross-wall (toward-the-water) motion. Null.
- The shape of the time series: acceleration, trend-breaks, the things that would show a wall starting to go. Null.
Four directions, and one answer across all of them: the free national product carries no segment-level signal for the replacement schedule, and the null is now mechanism-tested rather than an artefact of looking in the wrong place.
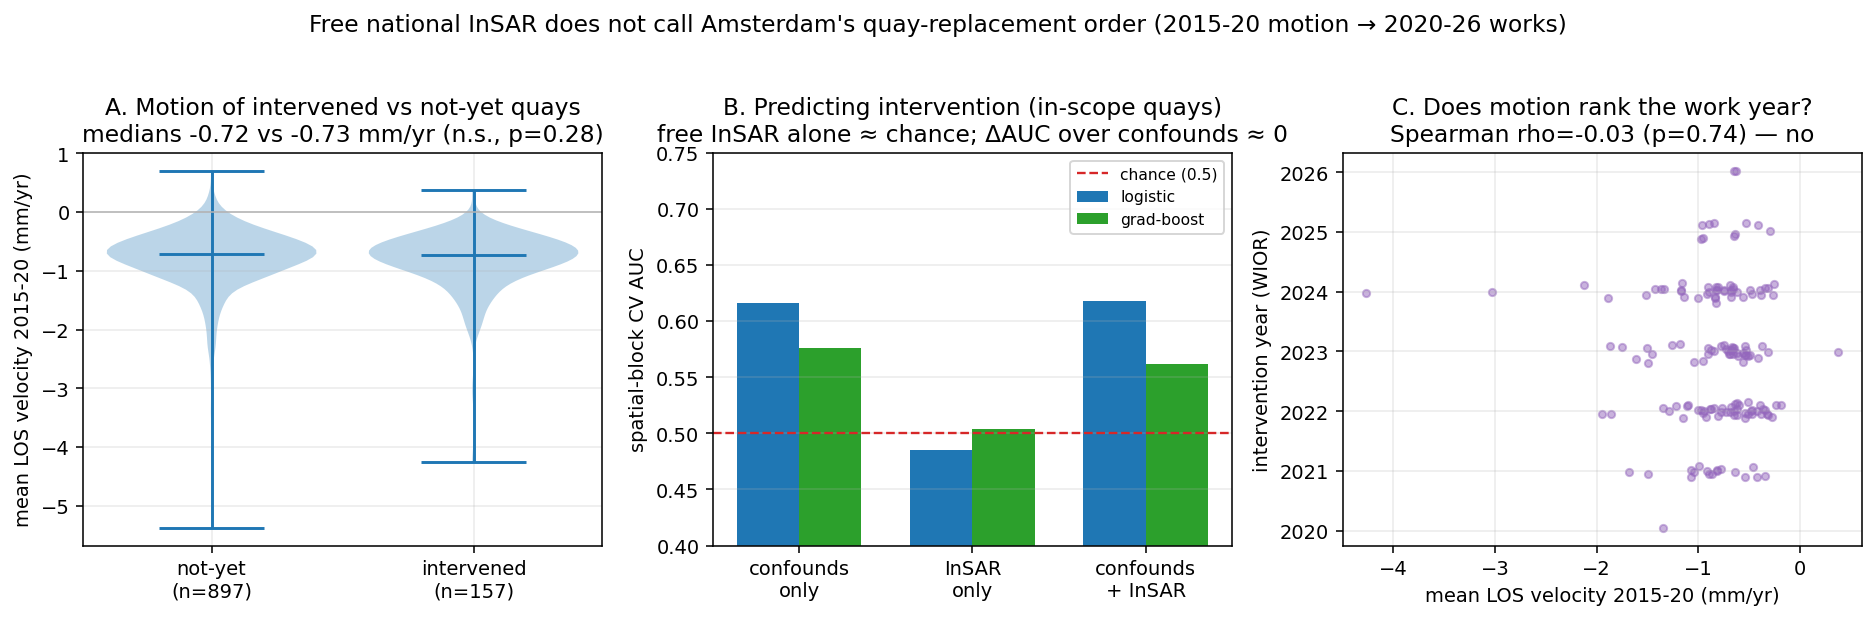
The simplest view of all is the one I find hardest to argue with: line up the walls the city worked on against the ones it has not, and look at how each group moved in the radar window. The two distributions sit on top of each other.
Why the satellite is blind to this particular thing
Four reasons, stacked: the first three about what the radar cannot see, the last about what even a clean measurement could not rank:
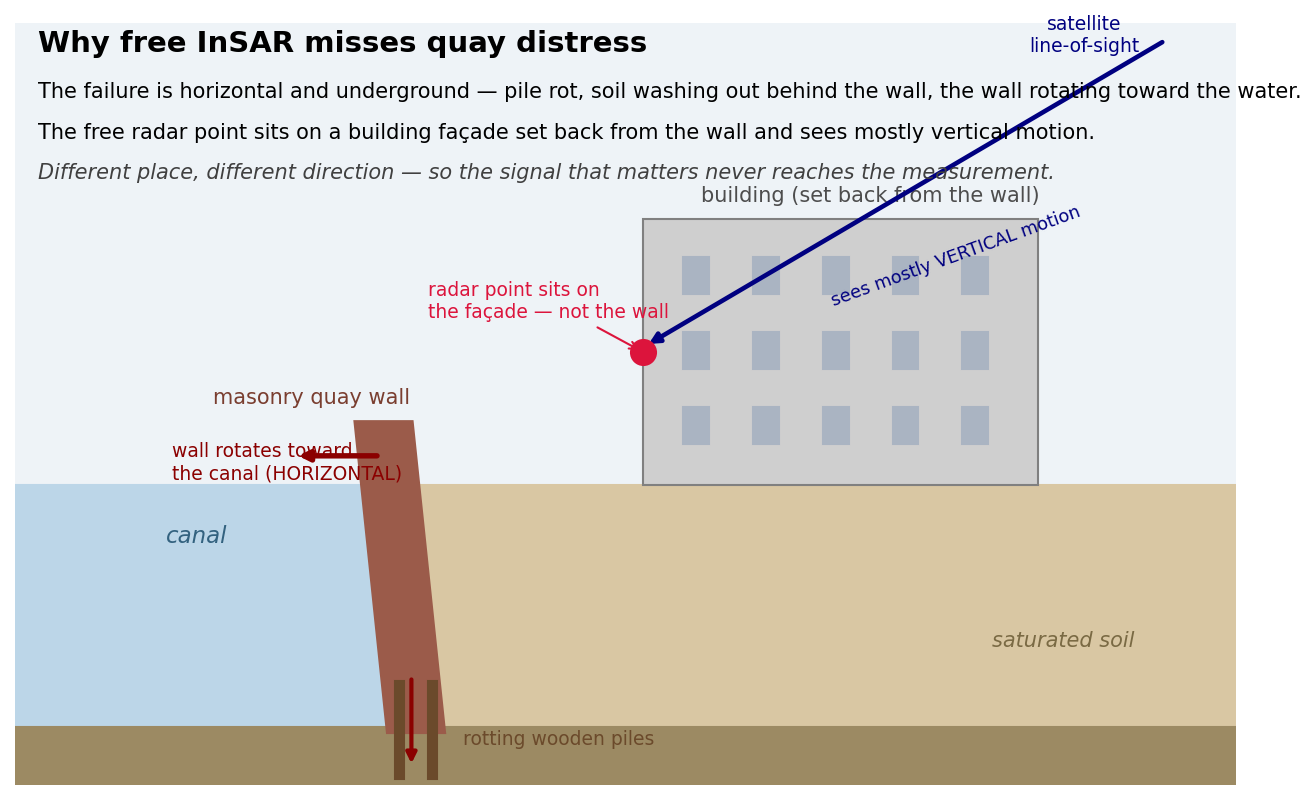
It does not measure the wall. This is the one that took me longest to internalise. There is a 2021 paper whose title says it outright: City Scale InSAR Monitoring of (Buildings Behind) Quay Walls, and the parenthetical is the whole story. A persistent scatterer needs a hard, stable surface that reflects the radar the same way pass after pass; the wall crest does not provide one, and the water certainly does not. What does provide one is the façade of the building set back behind the wall, typically 2.5 m or more above the street. So the measurement you get near a quay is the building, not the quay: a proxy for the wall through the shared soil and foundation, and a noisy proxy at that.
It points the wrong way. Sentinel-1 sees mostly vertical motion and is all but blind north–south, whereas the failure is horizontal rotation. The component of the real motion that lands in the line of sight is a small projection of an already-small number.
It cannot see the thing that is actually failing. What kills an Amsterdam quay is wood-pile decay: the pile tops rot once the groundwater table drops and exposes them to oxygen, since timber survives for centuries only while submerged and anoxic. That happens below the street, at and under the waterline, the one place no radar from orbit will ever reach.
The two groups barely differ. Across the inner canals the rates are on the order of 0.8 mm/yr, comfortably above the national product's per-PS velocity precision of ~0.05 mm/yr, so this is not a quantity the radar cannot measure. The trouble is that the walls the city has worked on and the ones it has not move almost identically (about −0.8 mm/yr each, a gap of well under 0.1 mm/yr). You cannot rank a list by a quantity on which the two groups overlap.
"But a company sells this, and it works": yes, and here is why that is not a contradiction
This is the objection I would be shouting at the screen too, so let me take it head-on, because the honest answer is the most interesting thing I learned.
There is a Dutch company, Sensar, that monitors quay walls with InSAR commercially (a product line that includes one literally called QuayScan), and it works well enough that the Port of Rotterdam pays for it. One thing should make you suspicious of my null: Sensar's system is Sentinel-1-capable: it can run on the same free Copernicus radar I used. It is multi-sensor (it also pulls RadarSAT-2 or TerraSAR-X), but Copernicus is on the menu. Same satellite, same data class, and the opposite outcome. So what do they have that I do not?
It is not a better sensor; the difference is the target, and the target is decisive.
Rotterdam's quays are radar-bright; Amsterdam's are radar-dark. A modern deep-sea port quay is a massive concrete structure (hard edges, bollards, deck furniture) of which the scatterers sit on the structure itself, and radar loves it. Amsterdam's inner-city walls are 17th-to-19th-century masonry on timber piles, with historic houses pressed right up behind them. There is nothing radar-stable on the wall, so, as the paper title already told us, the satellite measures the houses instead. Sensar measures the quay; I could only ever measure the building behind it.
Their clever processing solves a different hard problem than mine. Sensar's actual innovation, "Robust Scatterers", is about berths being occupied roughly 90% of the time: ships and container stacks block the view, so only about one acquisition in ten sees the quay clear. Their algorithm detects when the scene changes and stitches together the rare unobstructed glimpses, which is hard, and clever, and the wrong tool for my problem. My walls are not occluded; they are simply not reflective. No amount of scene-adaptive scatterer selection conjures a scatterer that is physically not there.
Their "forecast" is not my forecast. When Sensar projects future settlement, it is extrapolating a trend it has already measured on a structure that is visibly moving, which is a reasonable thing to do. It is not the same as asking, from a flat ~0.8 mm/yr signal on the building next door, which of a thousand walls the city will replace and in what order. And one detail reframed the whole field for me: even the TerraSAR-X study of these very quays (Venmans & Korff, 2020) reported around 3 mm precision, worse than a surveyor's levelling rod at ~0.5 mm. InSAR is rarely the precise instrument in these systems; it is the cheap, wide, fast screen, always validated against levelling, always fused with something else, never trusted alone.
So the commercial counterexample does not contradict the null; it explains it. A radar-bright concrete port quay with an occlusion problem is a different physics problem than a radar-dark masonry canal wall with a below-water failure mode. Sensar did not solve my problem with a better algorithm; they have a problem that InSAR can see.
Was it just me doing the radar badly?
There is a less flattering explanation for any null: maybe I just processed the data poorly. The cleanest thing that rules that out is a positive control. I pointed the identical pipeline at a signal I was sure exists (recent construction rather than quays), and it lights up with real skill: it separates fresh builds from old ones at an AUC around 0.83, exactly where the quay signal sat flat at 0.49–0.54. So the pipeline can find surface motion where there is surface motion to find, and the quay null is the data, not the code.
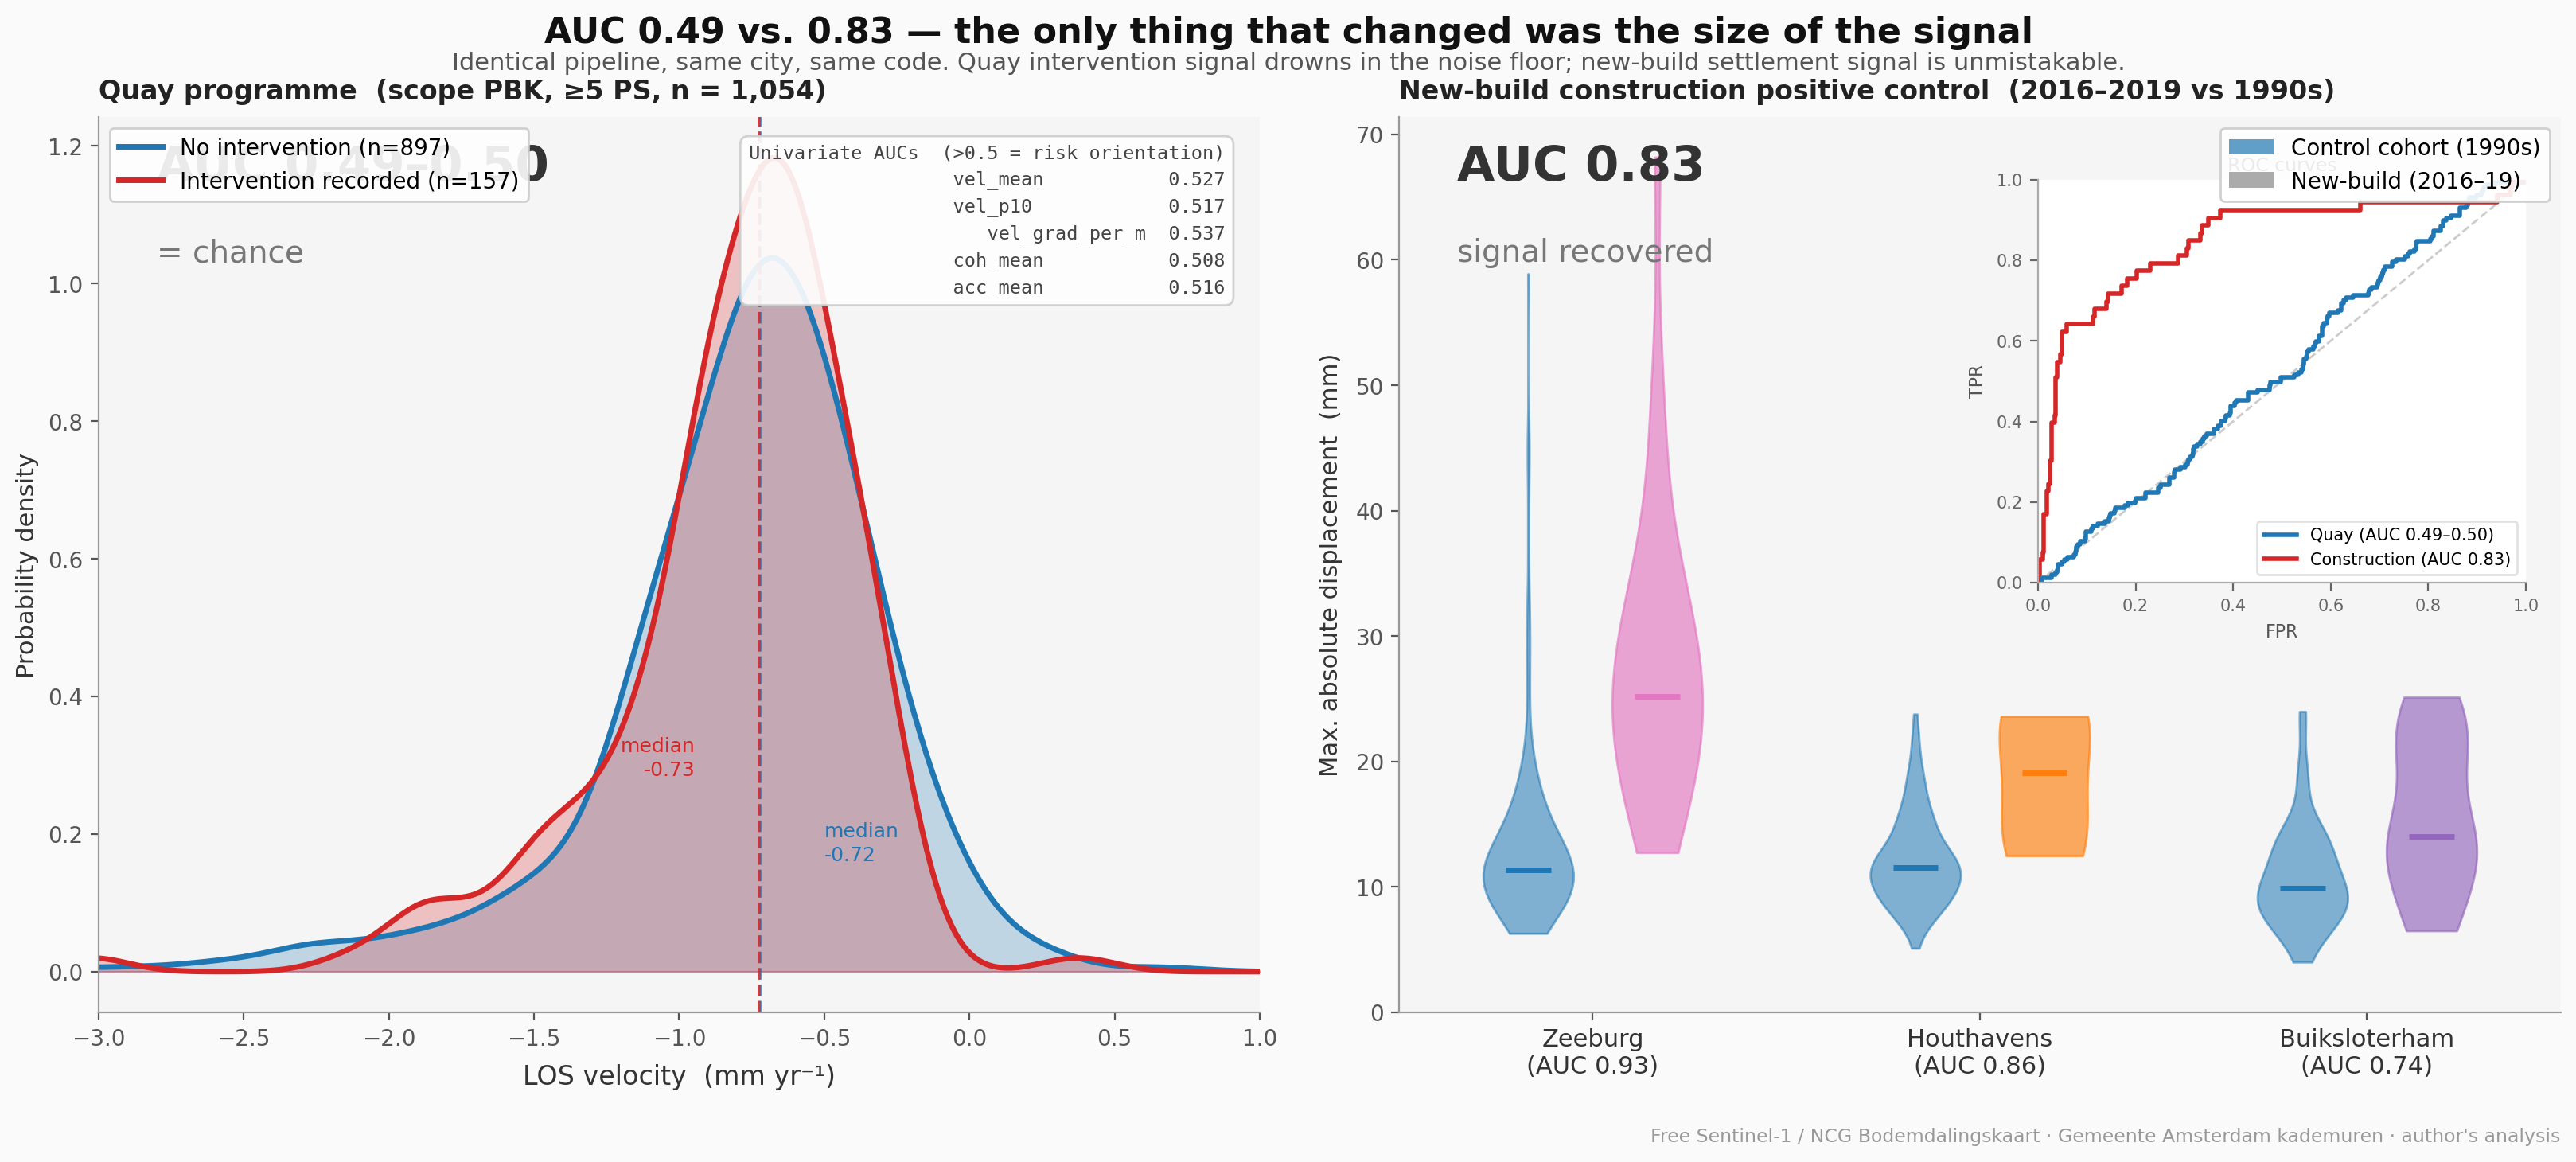 The same pipeline, two questions. Chance on the quay schedule (0.49), real skill on the construction control (0.83). The silence on the quays is the data, not the code.
That construction result is an interesting thread of its own (a positive control that doubles as its own detection method), but it is a different research question, and I am keeping the full write-up for a separate piece rather than bending this one around it. Here it does one job: it tells you the silence on the quays is real.
Limitations, and what would actually crack it
I did not accept the free product's null at face value. Here is the ladder I climbed, and where each rung stopped.
What I tried. The obvious lever is resolution: the free national map is multilooked to about 40 m, which averages away the individual building-scale scatterers, so I reprocessed the raw Sentinel-1 stack myself at native resolution. The scatterers come back, and a home-made map built that way agrees with the national product at neighbourhood scale; how well, and at what spatial grain, is the whole of the second post. But notice what a sharper product does not buy: it does not change the line of sight. A native-resolution scatterer still sits on the building façade, still measures a mostly-vertical projection, and still cannot see the below-water face where the wall actually fails. I also curated the points down to façades the way the commercial protocol does (keeping only scatterers 2.5 m or more above the street), and that does not touch the part of the failure that happens underwater either. (The east–west decomposition that broke the null came from the national product's two tracks, not this single-track reprocessing; a single ascending track cannot resolve it.) The binding constraint is the geometry and the data, not the cleverness of the processing.
What would actually crack it. Three things, in increasing order of how much I believe in them:
-
Measure the wall, not the building. This means putting hard radar targets (corner reflectors) physically on the walls, the Rotterdam on-structure approach, or flying a higher-resolution radar. Both cost money, and even then the wall crest is a marginal target. This buys you a measurement; it does not buy you a free one.
-
Fuse, do not replace. The actual state of the art for Amsterdam (the SkyGeo / Deltares / TU Delft work, written up in a 2025 geotechnical paper) never uses InSAR alone. It fuses InSAR with levelling, tachymetry, and crack surveys, with InSAR explicitly "supporting rather than necessary alone"; the decisive extra ingredient, the city's NEN2767 condition scores, is exactly the access-restricted data I could not get. A fused model would predict the schedule well. Note, however, what would be doing the predicting: the condition and age data, with the satellite riding along as a weak feature. That is a real tool; it just is not an InSAR result.
-
Get the ground truth. For the satellite-alone question the binding constraint was the radar: the signal is too small and in the wrong direction. What caps the next step, a fused model, is not the radar but data access: the city's machine-readable priority and condition tables are restricted, the clearest symptom being an HTTP 403 on the inspection data. The single highest-value next move is a municipal data request, not another week of processing. What it yields is not a better displacement rate; it is the schedule and condition ground truth that has been the binding constraint the whole time.
The honest read on all three: fusion would produce a working schedule model, and the InSAR would be the passenger, not the driver. The satellite-alone question (the one I actually asked) has a clean answer, and the answer is no.
What I would tell the next person who tries this
Do not ask a free, façade-located, vertically-looking, millimetre-noise product to forecast a horizontal, below-water failure on a structure it cannot see. It cannot, and now there is a mechanism-tested number to point at instead of a hunch. But do use it for what it is genuinely good at: large, fast, vertical signals such as new construction, dewatering, and the slow consolidation of reclaimed land. The same data that is useless for the quay schedule is excellent for those; the construction positive control hinted at exactly that, and chasing it properly is the next piece of work.
What would move this forward was never a better satellite or a bigger GPU; it is the fusion with the city's own in-situ data, and that sits behind a data request rather than a download. The cheap signal did not know what the engineers knew. The more I look at why, the more reasonable that seems: they were measuring the wall, and the satellite was measuring the house next door.
One last thing this post quietly took for granted: the Netherlands has this map. A free, national, millimetre-precision subsidence product, joined to the building register, handed to me to put on trial. Most countries have nothing of the sort, but the radar underneath it, Sentinel-1, covers most of the planet for free. So the obvious next question is whether you could rebuild the national map yourself from that raw signal, somewhere there is no national agency to do it for you, and how good a home-made one would actually be. That is the next post in this series: home-made maps held up against the real thing in Amsterdam, and the calibration curve that tells you how far to trust a rebuilt one.
Sources for the Rotterdam comparison: ESA Robust Scatterer InSAR (business.esa.int/projects/robust-scatterer-insar); Sensar (sensar.nl); Venmans, Korff et al., "Reliability of InSAR satellite monitoring of buildings near inner city quay walls," PIAHS 382, 2020; "City Scale InSAR Monitoring of (Buildings Behind) Quay Walls," IEEE 2021; Nicodemo, Venmans, Korff, Peduto, "The Quay Walls of Amsterdam … Multisource Monitoring and Surveying Data," JGGE 151(2), 2025; "Critical Factors for the Application of InSAR Monitoring in Ports," Remote Sensing 17(23), 2025.