Predicting Flooding Risk for Pan-European REIT Assets using Local Features
The standard pan-European fluvial flood hazard maps come from a 2D hydrodynamic simulation: accurate, but neither explainable nor adaptable. This BSc thesis (Artificial Intelligence, University of Amsterdam, 2022; industry partner KR&A) asks whether those simulated flood-return-period labels can be reproduced from local, interpretable features of a location. Thirty-three features across micro, meso and macro scales (precipitation extremes, ground type, artificial imperviousness at multiple radii, distance and relative height to the nearest river, terrain depressions, regional economics) are extracted for ~45,700 balanced samples drawn around all European towns above 1,000 inhabitants. A Random Forest reproduces the binary 20-year flood label at 97% accuracy and four ordered risk classes at 73.8%, with surrounding imperviousness and relative height dominating feature importance: an explainable-by-construction risk screen for real-estate portfolios.
Scritto con l'IA, verificato da me.
Reference
BSc thesis, Artificial Intelligence, University of Amsterdam (2022). Industry partner: KR&A, Amsterdam. Supervised by Sander van Splunter and Arjan Knibbe.
A flood map that can't answer "why?"
Europe's reference fluvial flood maps (Dottori et al. 2016; 250 m resolution, return periods from 10 to 200 years) fall out of a two-dimensional hydrodynamic simulation. They are good, but they are a black box twice over: they can't tell a portfolio manager why an asset is flood-prone, and they can't be refreshed when the neighbourhood around that asset changes. My question for KR&A, who screen pan-European real estate for exactly this kind of risk, was almost cheeky: can I reproduce the simulation's answers using only interpretable, local facts about a location?
Sampling half of Europe
I started from every European town above 1,000 inhabitants and drew flooded and non-flooded pixels across all return periods, balancing to roughly 7,600 samples per class. That makes ~45,700 points in total. Plotted, they trace Europe's river networks like a circulatory system: the Rhine delta, the Ruhr, the Seine basin, half of Spain.
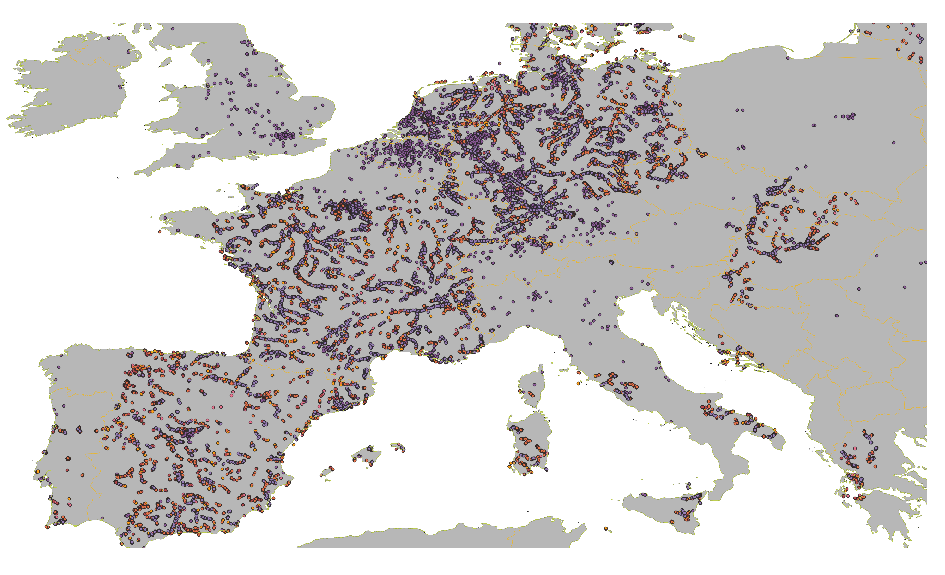 The full training set: ~45,700 sampled locations, colored by flood-return-period label, hugging Europe's rivers.
For each point I extracted 33 features in three scale bands. Micro: one-day and five-day precipitation maxima (2000–2019), monthly precipitation climatology, ground type, and artificial imperviousness (the paved-surface share) at the point and within 500 m, 1 km and 5 km. Meso: distance to the nearest river, relative height and terrain depressions versus the surroundings, relative height versus that river. Macro: regional GDP and GDP per capita joined on NUTS3, plus two governance indicators.
What the forest learned
I raced three models (logistic regression, a Random Forest, and a neural network) on three versions of the label. The Random Forest won every round: 97% on the binary "does this flood within a 20-year return period?" question (97.19% on KR&A's own held-out asset portfolio), 73.8% on four ordered risk classes, 58.5% on all six return periods.
The fun part is why. Crack open the forest and the very first split is imperviousness within 500 m:
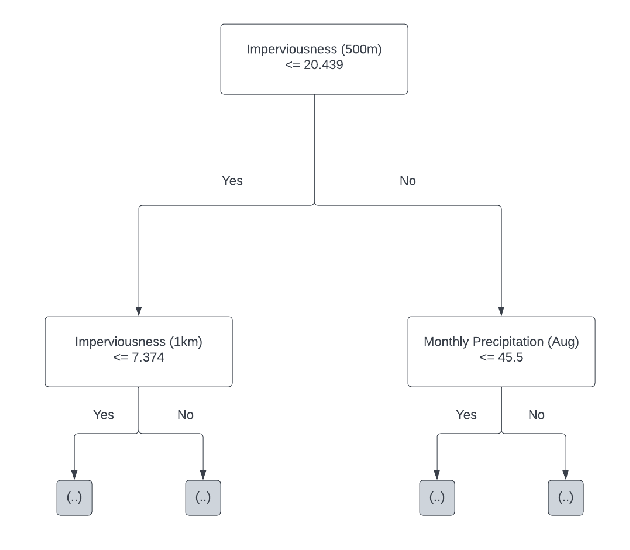 The forest's opening move: is more than ~20% of the surrounding 500 m paved?
That's not a fluke of one tree. Across the whole binary model, the four imperviousness radii soak up 62% of the total feature importance, with regional economics a distant second and precipitation barely registering:
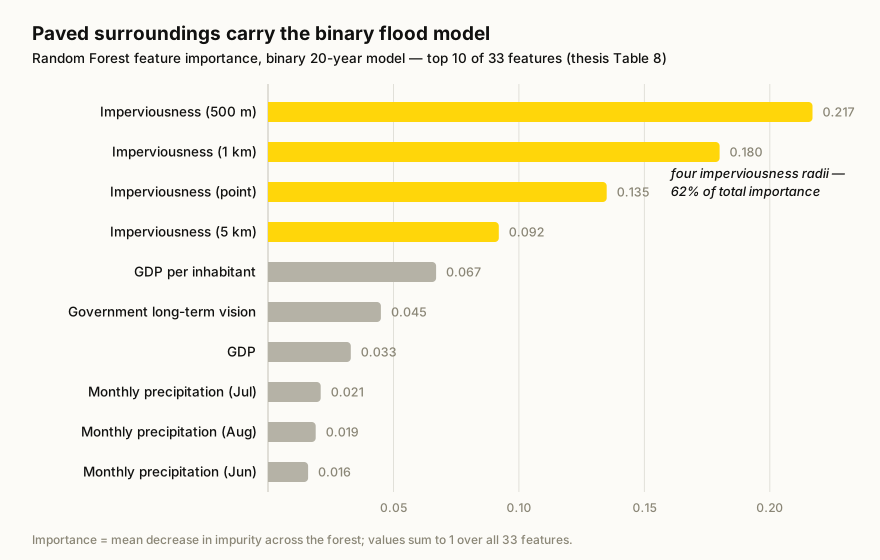 Feature importances for the binary model (thesis Table 8): paved surroundings carry the prediction.
In the multi-class models, relative height to the surrounding terrain joins as the second big family. The model rediscovered hydrology on its own: paved, low-lying places near rivers flood. And it can show that reasoning per asset.
Why this matters (and where it stops)
The payoff is a screening layer that's explainable by construction. Every asset gets not just a flood class but the local factors driving it, and the inputs can be refreshed as land cover changes, something a frozen simulation output will never do. I'm equally upfront about the limits: the simulation is treated as ground truth, accuracy is the only reported metric, and the non-flooding sample construction is flagged for future work. It was a BSc thesis, not a product. But it convinced me that "explain, don't just simulate" is a viable stance for geospatial risk.